What’s up, everyone — and welcome back to the weekly betting value article on JosephSrigley.com. I’ve been a NASCAR fan my entire life. My earliest memory is Geoff Bodine taking the checkered flag in the 1986 Daytona 500. I stepped away for a stretch, then came roaring back through fantasy racing and sports betting. That return forced me to build my own data-driven ranking system from raw lap-by-lap data. Every bet I make starts with the model. Only then do I hunt for value against the market.
Track & Race Overview
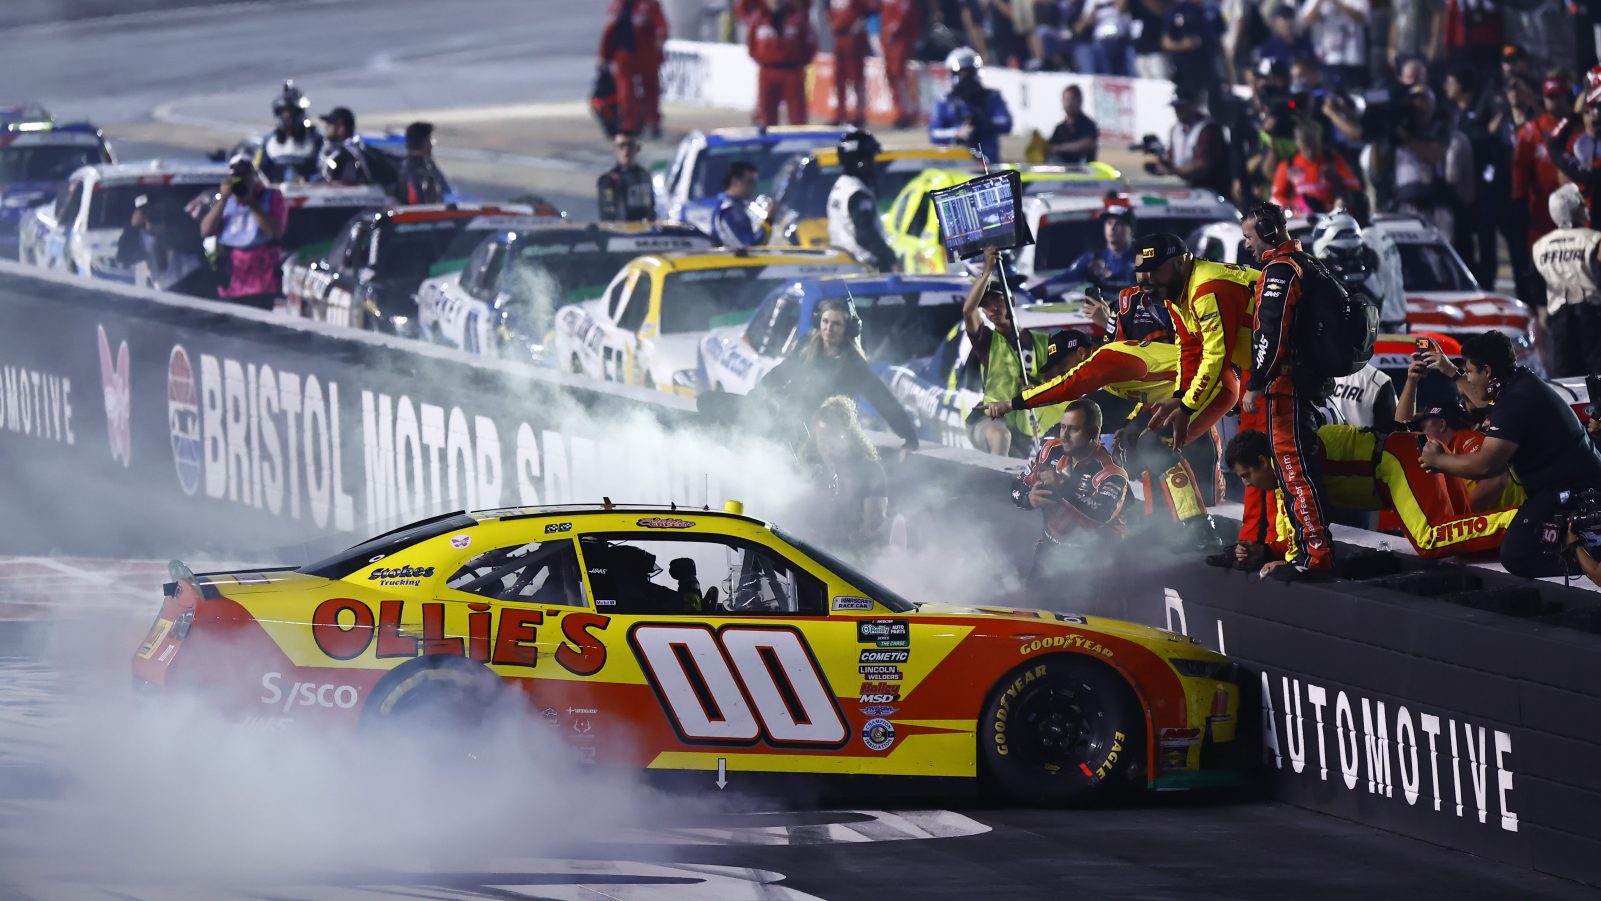
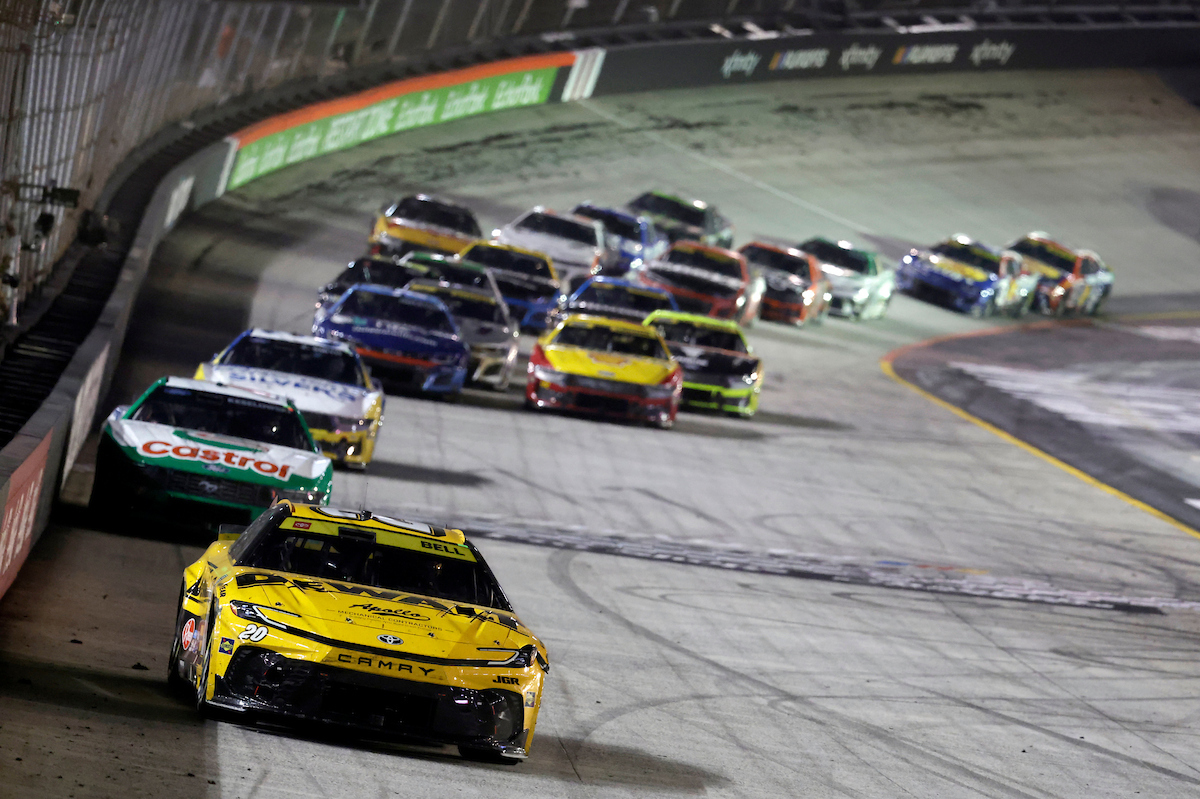
This weekend the Cup Series heads to the high banks of Bristol Motor Speedway for Race 3 of The Chase. Bristol is very unique as a high-banked short track. The track has variable banking, so there is more banking the higher you are in the corners. Also, they will spray the sticky stuff in the lower groove. As the weekend goes on, you can monitor how much they spray and try to keep track how quickly it wears off. Some cars will be good in the low lane and some in the high lane, so knowing when the sticky stuff stops working could payoff.
The track: 0.533-mile concrete oval
- Turns: 24–28 degrees
- Straights: 4–8 degrees
Race details:
- Distance: 500 laps / 266.5 miles
- Stage 1: 125 laps
- Stage 2: 125 laps
- Final stage: 250 laps
Comparable Tracks
Bristol doesn’t really have a twin, so track history is still the best film study. If you want a concrete-angle comp, Dover and Nashville are the closest. If you want a momentum-track comp, I’d add Dover and Darlington. Cup didn’t run a regular race at Dover this year — just the All-Star — so I’m still leaning hardest on Bristol itself.
About the Model
I don’t use NASCAR loop data. I build 15 proprietary metrics straight from lap-by-lap timing. Those metrics feed the model and spit out projected win, top-3, top-5, and top-10 percentages for every driver — plus a fair market value (FMV) for each market. One important note: the model is predicting speed, not finishing position. Over 266 miles, strategy, pit calls, and pure Bristol chaos can still let a slower car steal the win.
Who the Model Likes
Six names show value across the board this week:
Ryan Blaney
Model Rank: 2nd
FMV Win: +564 | Top 3: +156 | Top 5: -129
Blaney should have won here in the spring. He led 190 laps and lost by 0.055 seconds. Pit road was the problem. The speed was already there.
Denny Hamlin
Model Rank: 3rd
FMV Win: +560 | Top 3: +160 | Top 5: -128
Quiet through the first two Chase races, still the points leader. This stretch sets up well for him, with three 1.5-milers coming next.
Chase Briscoe
Model Rank: 5th
FMV Win: +736 | Top 3: +200 | Top 5: -102
Briscoe’s whole act is lurking. He hangs around the front, then pounces when the race opens up.
Tyler Reddick
Model Rank: 7th
FMV Win: +2051 | Top 3: +499 | Top 5: +227
Reddick was ripping the high line in the spring and tagged the wall. If the top comes in early, he’s dangerous.
Bubba Wallace
Model Rank: 8th
FMV Win: +2419 | Top 3: +549 | Top 5: +250
Trust him to live in the top 10 all night. That’s the play.
Carson Hocevar
Model Rank: 9th
FMV Win: +2345 | Top 3: +558 | Top 5: +256
Finished worse than he ran here in the spring. Strategy shuffled him back. The car was better than the result.
Recommended Bet
I never fire on every number the model spits out — especially before practice and qualifying. Right now I’m only willing to play one spot, and I’m playing it small: 0.25 units. I’m primarily a post-practice / qualifying bettor. Odds move fast.
Carson Hocevar Top Chevy +900
I have Carson as the second-best Chevy this week. If Larson hits trouble, this cashes. The number is too fat to ignore at this stage of the weekend.
Also on the board:
Bubba Wallace Top 10 +155
Tyler Reddick Top 10 +120
Personal Rankings
As a thank you for the support last week, here’s this week’s Top 3 Tiers in my personal rankings.
Betting Glossary
Quick definitions for the key terms used in this report, with real examples pulled straight from the article:
Fair Market Value (FMV)
The odds the model believes a driver should be priced at based on projected performance.
Example: Tyler Reddick’s FMV sits at +608. If the actual market offers longer odds than that, the model sees value.
Value / Flashing Value
When the market odds are longer (higher payout) than the model’s fair market value. You’re getting a better price than the model thinks the true probability deserves.
Example: “My model is showing clear value on two drivers” and “Other drivers flashing value on the win market.”
Win Market / To-Win
Betting on a driver to finish 1st.
Example: The entire “To-Win Value” section lists drivers the model likes to take the checkered flag at prices better than their FMV.
Placement Props (Top 3 / Top 5 / Top 10)
Bets on a driver finishing inside a specific position range rather than winning outright. These usually offer shorter odds but higher hit rates.
Example: “Byron Top 3 FMV +267 and Top 5 +145” and the recommended “William Byron Top 5 +225.” American Odds (+ numbers)
The standard U.S. format. A +608 price means $100 bet wins $608 in profit (plus your $100 stake back). Higher positive numbers = bigger underdogs and bigger potential payouts.
Example: John Hunter Nemechek’s win FMV of +4333 or his Top 10 at +201.Pre-Practice / Pre-Qualifying Model
Rankings generated before any on-track activity this weekend. These numbers will shift once practice speeds and qualifying results come in.