What’s up, everyone — Welcome back to my weekly Betting Value article on JosephSrigley.com.
I’ve been a NASCAR fan my entire life. My earliest memory is Geoff Bodine taking the checkered flag in the 1986 Daytona 500. I stepped away for a while, then came roaring back through fantasy racing and sports betting. That return forced me to build my own data-driven ranking system from raw lap-by-lap data. Every single bet I make starts with the model. Only then do I hunt for value against the markets.
TRACK AND RACE OVERVIEW:
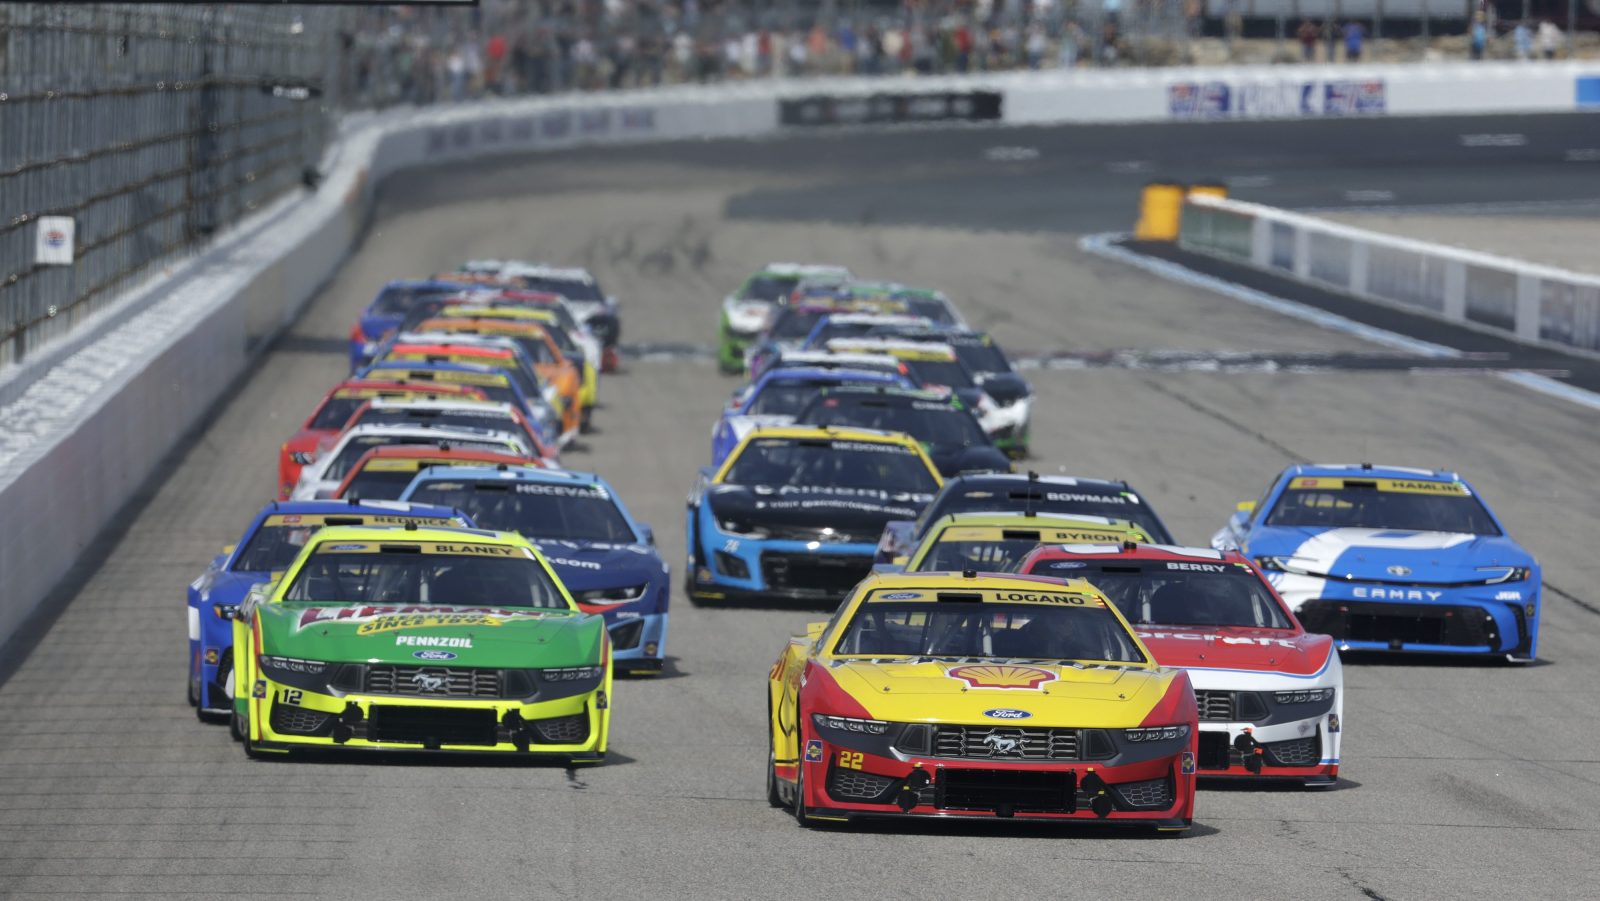
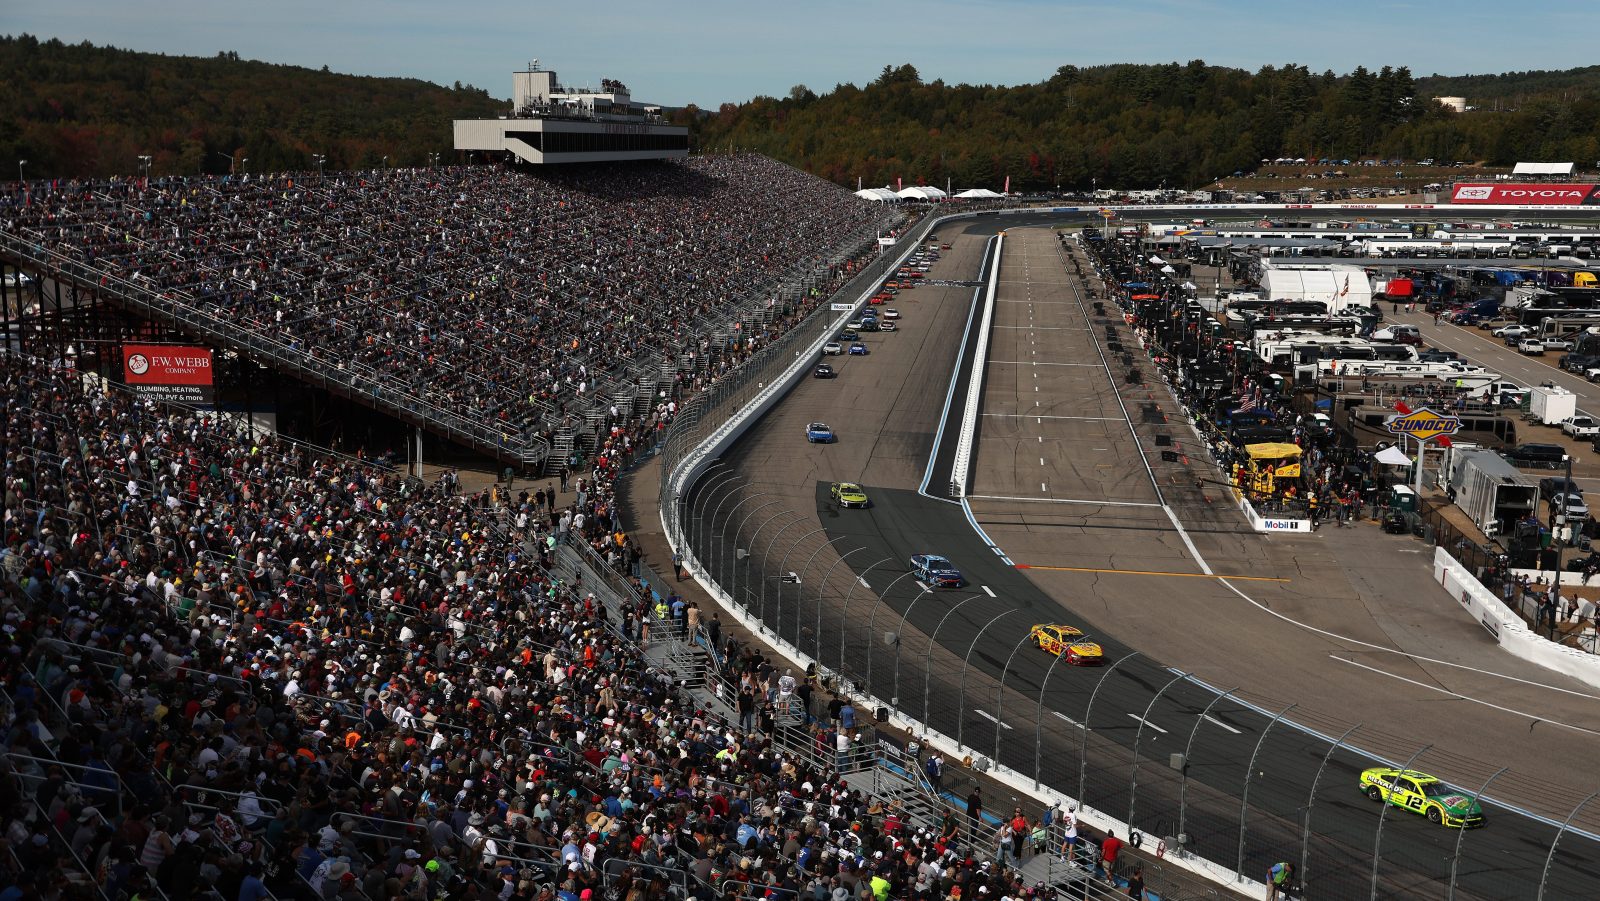
This weekend the NASCAR Cup Series remains on the flat short track of New Hampshire Motor Speedway for the Dollar Tree 301. The 1.058-mile oval features banking from two degrees to seven degrees in the corners, and just one degree on the frontstretch and backstretch.
Race Distance: 301 Laps / 318.46 Miles
Stage 1: 70 Laps
Stage 2: 115 Laps
Stage 3: 116 Laps
COMPARABLE TRACKS
New Hampshire fits the classic short, flat-track profile. The strongest comps are Phoenix, Martinsville, North Wilkesboro, Iowa, Gateway, Richmond, and of course, Loudon itself. I’ll lean hardest on historical performance here at New Hampshire while mixing in results from the other short flats this season.
ABOUT THE MODEL:
I don’t use any NASCAR loop data. Instead, I build 15 proprietary metrics straight from lap-by-lap data. Those metrics feed the model and produce projected win, top-three, top-five, and top-10 percentages for every driver — plus a fair market value (FMV) for each market. One important note: the model is predicting speed, not finishing position. Over the course of a race, strategy, pit calls, and pure chaos can still let a slower car steal the win.
WHO THE MODEL LIKES:
The model is highlighting FIVE drivers with clear value this week:
- RYAN BLANEY (FMV ODDS: +357 Win, -104 T3, -229 T5): Team Penske continues to own the short flat tracks this season, and Ryan Blaney is the defending winner of this race.
- JOEY LOGANO (FMV ODDS: +532 Win, +135 T3, -134 T5): No surprise seeing Blaney’s teammate right behind him. Logano just won at Richmond Raceway and posted an Average Running Position of 1.99 at New Hampshire in 2025.
- WILLIAM BYRON (FMV ODDS: +589 Win, +156 T3, +240 T5): William Byron keeps on showing up every single week, and the entire Hendrick Motorsports stable is quietly getting stronger.
- CHASE ELLIOTT (FMV ODDS: +1916 Win, +447 T3, +600 T5): Like the rest of the Hendrick Motorsports brigade, Chase Elliott hasn’t had the same caliber of equipment this season as he usually does — but the model still sees him climbing.
- CARSON HOCEVAR (FMV ODDS: +6844 Win, +1214 T3, +516 T5): Carson Hocevar had a solid run at New Hampshire in 2026, but I’m not seeing enough on the short flats to get involved at these prices.
RECOMMENDED BETS:
I never fire on every number the model spits out — especially before practice and qualifying. Right now, I’m only willing to play one spot at a small stake (0.25 units). I’m primarily a post-practice/qualifying bettor, and odds move fast.
PRIMARY PLAY: William Byron, Top-10 +100
PIVOT PLAY: Chase Elliott, Top-10 +100
Hendrick Motorsports is improving every single week. Richmond showed us the cream is rising to the top – the best teams finished exactly where they belonged. I’m leaning into that trend. Always find the best odds you can and always check the prediction markets like Kalshi.
As a thank you for the tremendous support (again!) last week, here’s the top-12 in my personal rankings:

FINAL THOUGHTS:
I’ll update the model after practice and qualifying. Rankings can swing hard once the cars hit the track. If you want to follow along, check out Before The Green on YouTube and X (@HighLineBetting). Sunday 11:00 AM ET.
BETTING GLOSSARY
Fair Market Value (FMV): The odds the model believes a driver should be priced at based on projected performance. Example: Tyler Reddick’s FMV is +608. If the actual market offers longer odds than that, the model sees value.
Value / Flashing Value: When the market odds are longer (higher payout) than the model’s fair market value. You’re getting a better price than the model thinks the true probability deserves. Example: “My model is showing clear value on two drivers” and “other drivers flashing value on the win market.”
Win Market / To-Win: Betting on a driver to finish 1st. Example: The entire “to-win value” section lists drivers the model likes to take the checkered flag at prices better than their FMV.
Placement Props (Top 3 / Top 5 / Top 10): Bets on a driver finishing inside a specific position range rather than winning outright. These usually offer shorter odds but higher hit rates. Example: “Byron Top 3 FMV +267 and Top 5 +145” and the recommended “William Byron Top 5 +225”.
American Odds (+ numbers): The standard U.S. format. A +608 price means a $100 bet results in $608 in profits (plus your $100 stake back). Higher positive numbers = bigger underdogs and bigger potential payouts. Example: John Hunter Nemechek’s win of +4333 or his Top 10 at +201.
Pre-Practice / Pre-Qualifying Model: Rankings generated before any on-track activity this weekend. These numbers will shift once practice speeds and qualifying results come in.