It’s time for the NASCAR Cup Series Chase for the Championship. The season has changed; things have gotten more intense and more high-stakes, but HighLine Betting is still back with the weekly betting value report on JosephSrigley.com.
After stepping away from NASCAR for a period of time, HighLine Betting has come back through fantasy racing and sports betting, a return that forced him to build his own data-driven ranking system from raw lap-by-lap data. Every bet made starts with the model. Only then does the hunt for value against the market begin.
TRACK AND RACE OVERVIEW
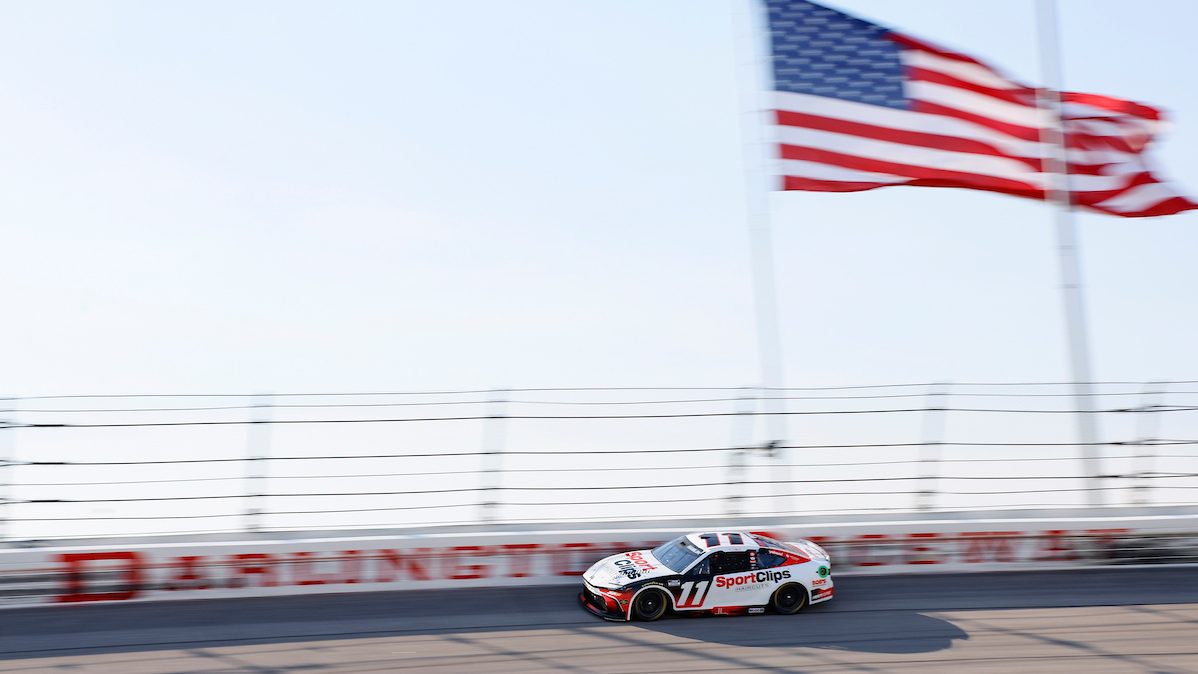
This weekend, the NASCAR Cup Series hits the historic Darlington Raceway – AKA The Lady in Black or The Track Too Tough to Tame – and the first race of the 2026 NASCAR Cup Series Chase.
The racetrack is a 1.366-mile egg-shaped oval with 25 degrees of banking in Turns 1 and 2, 23 degrees in Turns 3 and 4, and six degrees on the straightaways.
RACE DETAILS:
- Race Distance: 367 Laps / 501.32 Miles
- Stage 1: 115 Laps
- Stage 2: 115 Laps
- Stage 3: 137 Laps
The two ends of the racetrack require different setups; the surface eats tires, and the outside retaining wall seems to do the officiating.
COMPARABLE TRACKS:
Darlington Raceway is its own animal. Homestead-Miami Speedway is its closest relative on paper, but the NASCAR Cup Series hasn’t been there in almost a year and a half. This week, I’m leaning on track history more than comps.
ABOUT THE MODEL:
I don’t use NASCAR loop data. I build 15 proprietary metrics straight from lap-by-lap timing. Those metrics feed the model and spit out projected win, top-3, top-5, and top-10 percentages for every driver — plus a fair market value (FMV) for each market. One important note: the model is predicting speed, not finishing position. Over 500 miles, strategy, pit calls, and pure chaos can still let a slower car steal the win.
WHO THE MODEL LIKES:
The model is liking FOUR drivers across the board this week; those drivers are:
DENNY HAMLIN
Model Rank: P1
FMV –> WIN +460, T3 +140, T5 -145
Can Denny Hamlin get red-hot again after a stretch of short tracks cooled him off (at least, relatively speaking)? Hamlin and the Toyota Racing USA drivers roll into the post-season as the odds-on championship favorites. However, the open question is whether the new front bumper pieces have taken some of Toyota’s edge on the high-speed ovals. If the speed is still there, he’s the clearest favorite on the board.
WILLIAM BYRON
Model Rank: P4
FMV –> Win +850, T3 +240, T5 +120
William Byron keeps showing up on the ranks week after week. The problem isn’t the number. It’s the trust. I can’t get there with this team right now, no matter how often the model puts him in the conversation.
TY GIBBS
Model Rank: P5
FMV –> Win +1050, T3 +290, T5 +140
Ty Gibbs is the type of driver who can get hot at the exact wrong time for everyone else and win the whole thing. For Sunday specifically, I’m less interested in the win number and more interested in a plus-money top-10 if you can still find one.
CHRIS BUESCHER
Model Rank: P7
FMV –> Win +1500, T3 +390, T5 +190
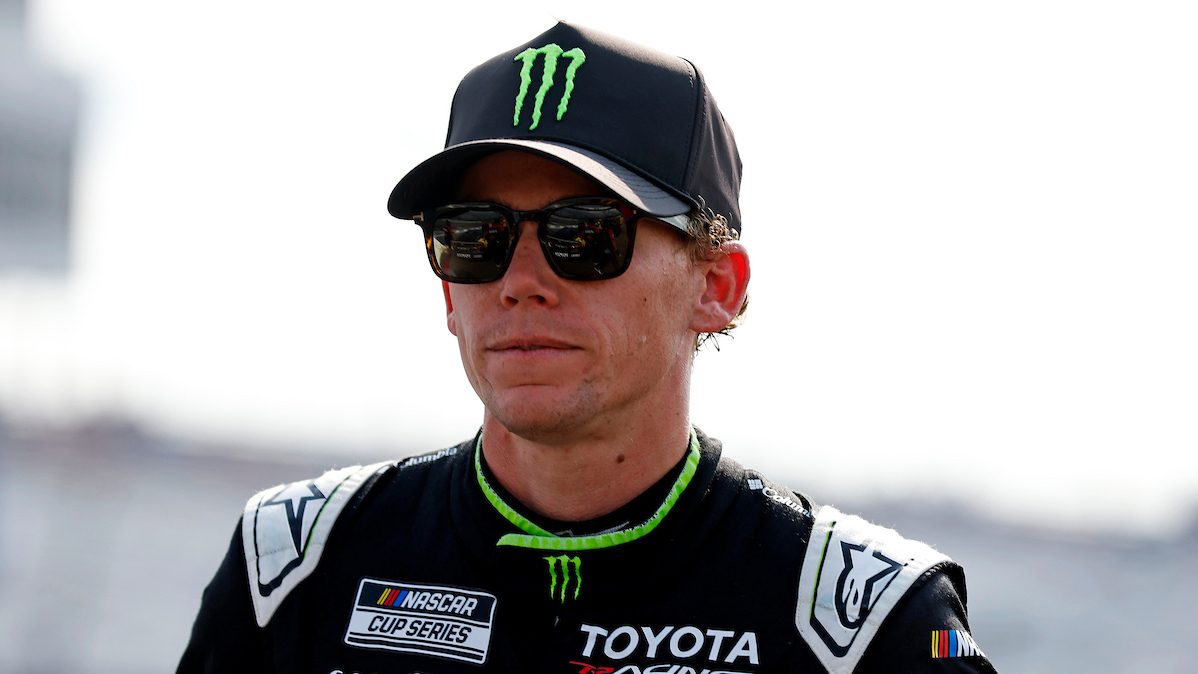
Chris Buescher and RFK Racing almost always have solid speed at Darlington Raceway. I don’t think this is top-five speed. I do think top-10 is well within range, though.
RECOMMENDED BET:
I NEVER fire on every number the model spits out — especially before practice and qualifying. Right now, I’m only willing to play one spot, and I’m playing it small: 0.25 units. I’m primarily post-practice / qualifying bettor. Odds move fast.
Chris Buescher + 100 Top-10
RFK and Buescher should have top-10 speed all race. The biggest concern is Hendrick Motorsports showing up with Chase-opening magic. Shop the number. Don’t just take the first +100 you see.
As a thank you for all of the support, here’s this week’s top-13 in my rankings:

FINAL THOUGHTS:
If you want to follow along, check out Before The Green on YouTube and X (@HighLineBetting) on Sunday at 11:00 AM ET. Appreciate you reading. Drop a comment and tell me what you think.
BETTING GLOSSARY:
Quick definitions for the key terms used in this report, with real examples pulled straight from the article:
Fair Market Value (FMV)
The odds the model believes a driver should be priced at based on projected performance.
Example: Tyler Reddick’s FMV sits at +608. If the actual market offers longer odds than that, the model sees value.
Value / Flashing Value
When the market odds are longer (higher payout) than the model’s fair market value. You’re getting a better price than the model thinks the true probability deserves.
Example: “My model is showing clear value on two drivers” and “Other drivers flashing value on the win market.”
Win Market / To-Win
Betting on a driver to finish 1st.
Example: The entire “To-Win Value” section lists drivers the model likes to take the checkered flag at prices better than their FMV.
Placement Props (Top 3 / Top 5 / Top 10)
Bets on a driver finishing inside a specific position range rather than winning outright. These usually offer shorter odds but higher hit rates.
Example: “Byron Top 3 FMV +267 and Top 5 +145” and the recommended “William Byron Top 5 +225.” American Odds (+ numbers)
The standard U.S. format. A +608 price means $100 bet wins $608 in profit (plus your $100 stake back). Higher positive numbers = bigger underdogs and bigger potential payouts.
Example: John Hunter Nemechek’s win FMV of +4333 or his Top 10 at +201.Pre-Practice / Pre-Qualifying Model
Rankings generated before any on-track activity this weekend. These numbers will shift once practice speeds and qualifying results come in.