By: HighLine Betting
What’s up, everyone – and welcome to my first article for JosephSrigley.com. I’ve been a NASCAR fan my entire life. My earliest memory is Geoff Bodine taking the checkered flag in the 1986 DAYTONA 500. I stepped away for a stretch, then came roaring back through fantasy racing and betting. The return forced me to build my own data-driven ranking system from raw lap-by-lap data. Every single bet I make starts with the model. Only then do I hunt for value against the markets.
Track and Race Overview
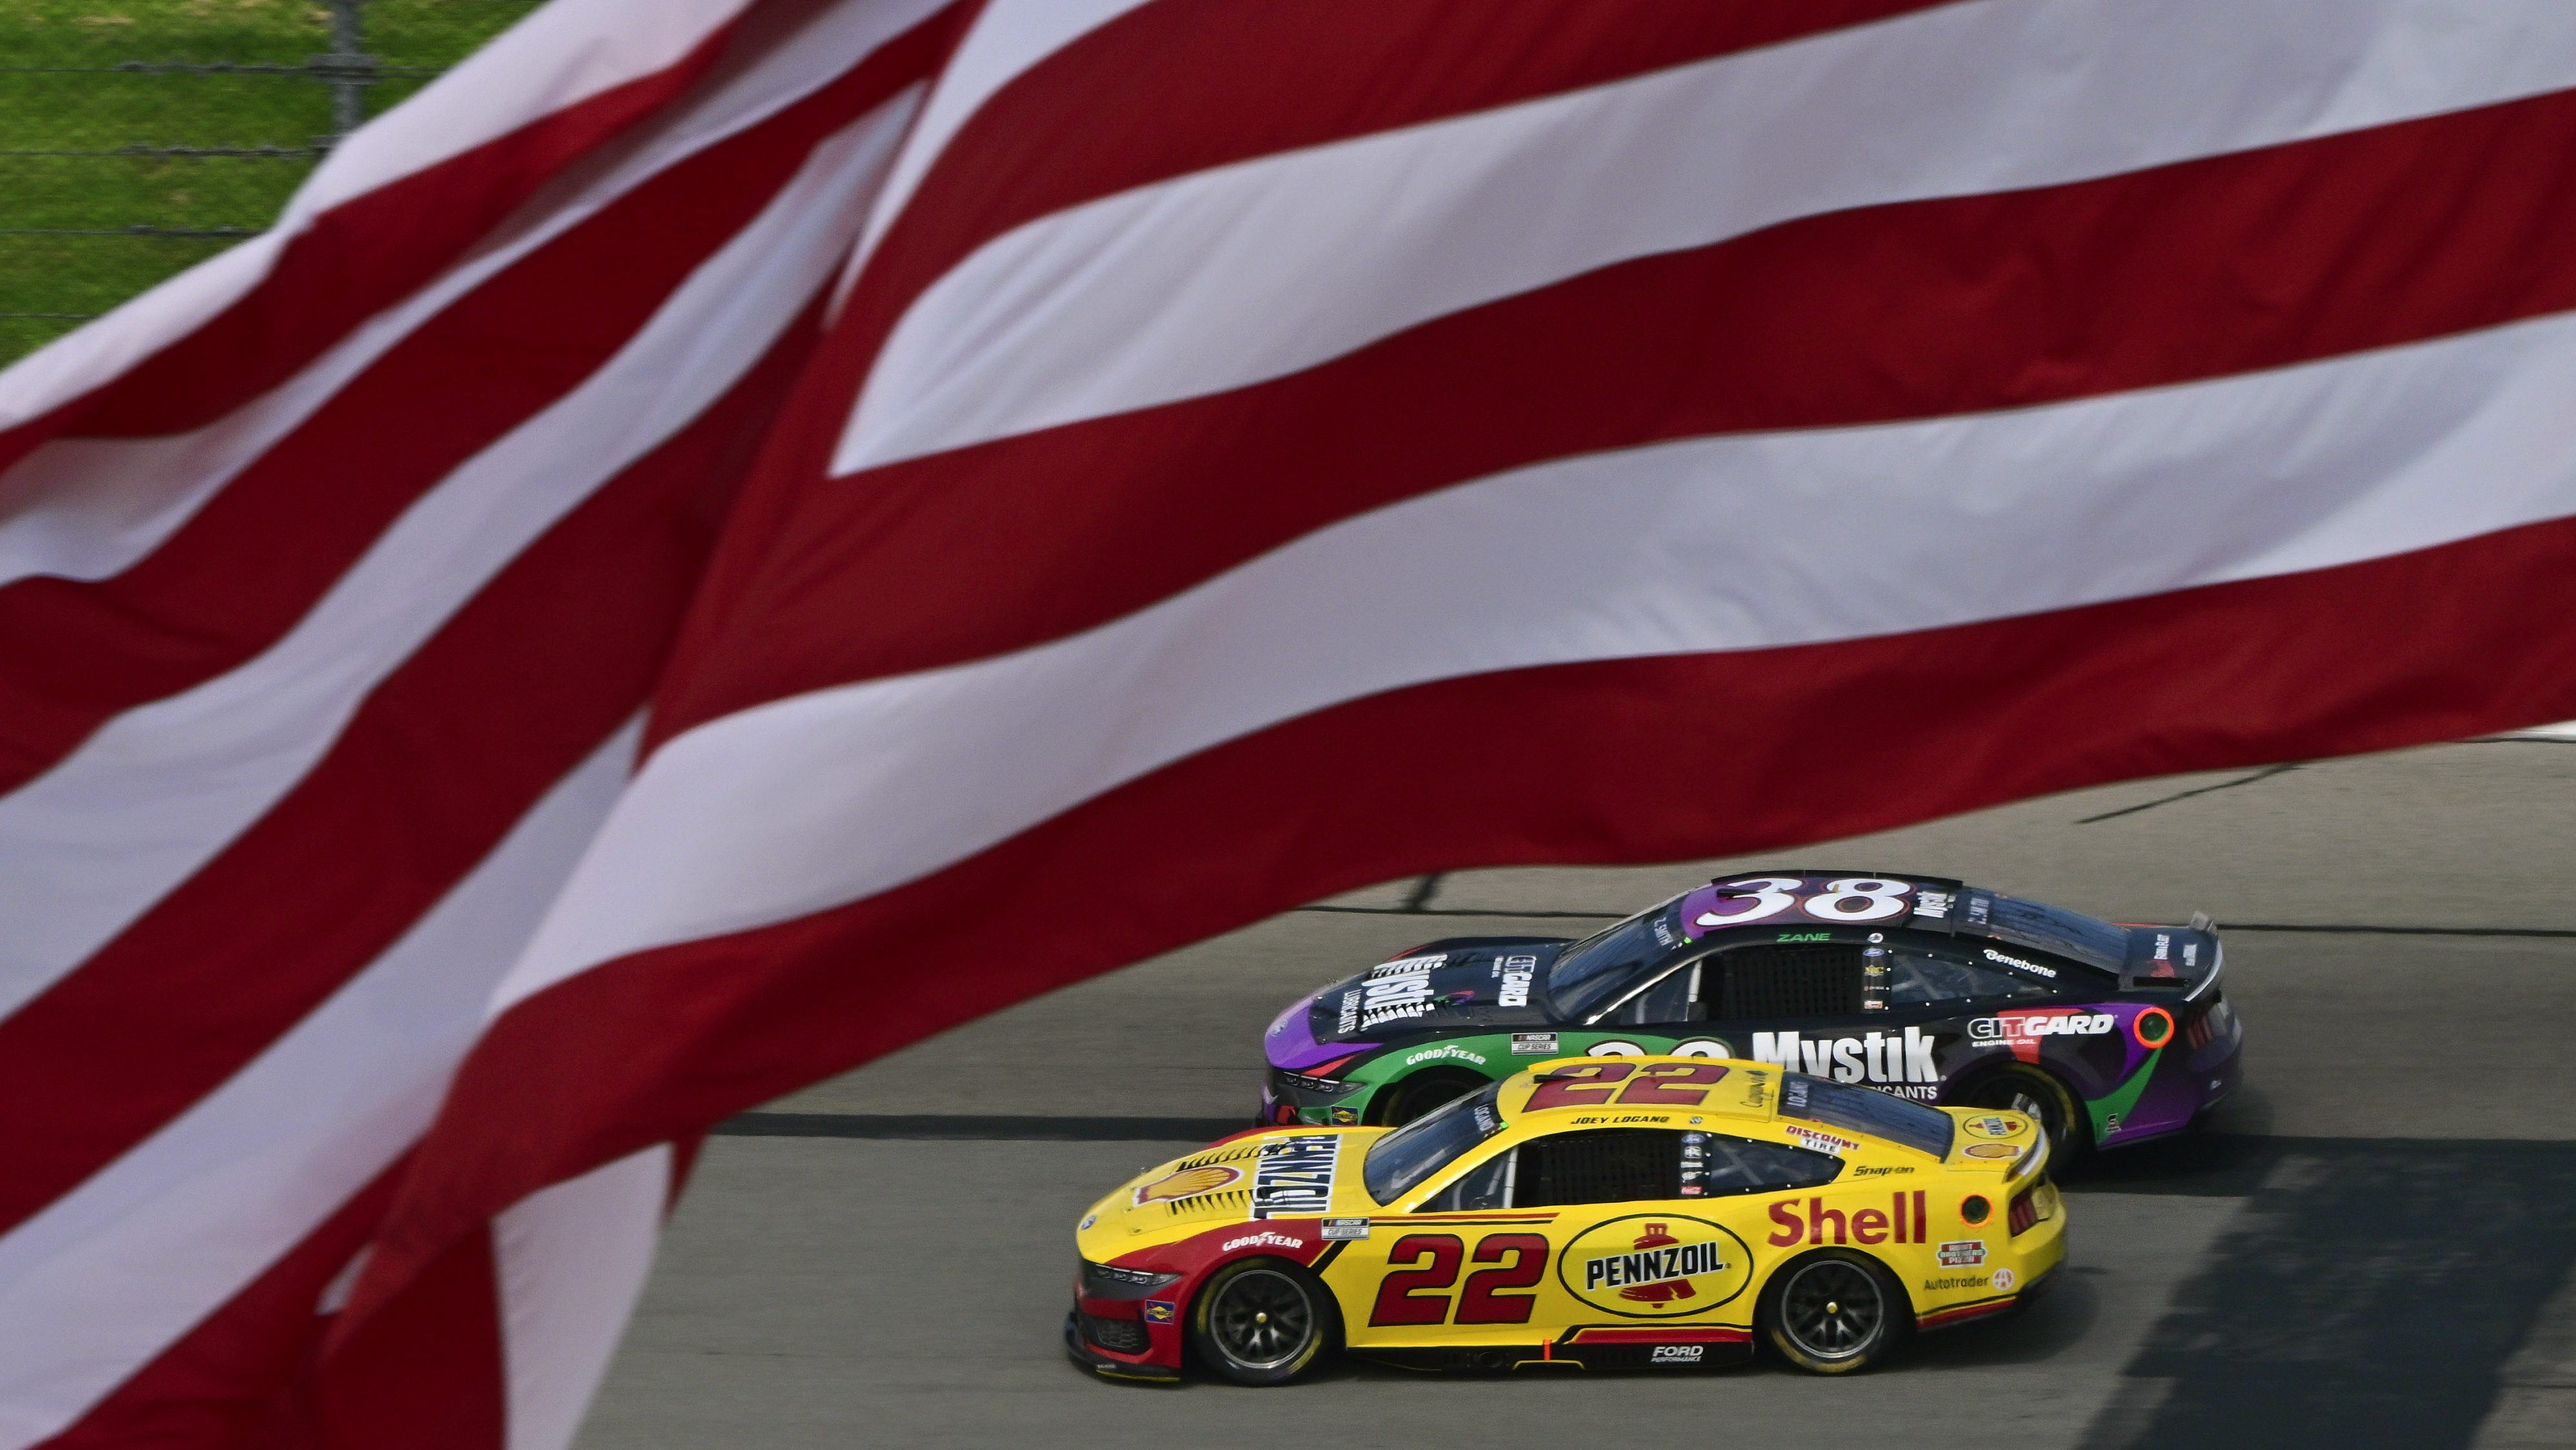
This weekend the NASCAR Cup Series returns to Iowa Speedway for the Iowa Corn 350. The 0.875-mile oval features progressive banking of 12-14 degrees in the corners. This is only the third time the NASCAR Cup Series has raced there, and with a full repave coming next year, the track has already confirmed its return in 2027 on Independence Day Weekend.
Race Details
Distance: 350 laps / 306.25 miles
Stage 1: 70 Laps
Stage 2: 140 Laps
Stage 3: 140 Laps
NEW, beginning this weekend at Iowa, if a caution is displayed within the final 10 laps of either Stage 1 or Stage 2, that stage will be deemed official and points will be awarded as soon as the field comes back to the green-and-white checkered flag.
Comparable Tracks
Iowa fits the short, flat-track profile. Useful comparisons typically include Phoenix, Martinsville, North Wilkesboro, Richmond, Loudon, and Gateway. Through this model, I’ll lean the hardest on the 2026 events at Phoenix and North Wilkesboro.
About The Model
I don’t use any NASCAR Loop Data. Instead, I build my own metrics straight from lap-by-lap data. Those 15 metrics feed the model and produce a sheet showing each driver’s projected win, top-three, top-five, and top-10 percentages, plus a fair market value for those outcomes.
Who The Model Likes
At the top of the board this week sit the Team Penske Ford Mustang Dark Horses of Ryan Blaney (No. 1) and Joey Logano (No. 2). Blaney owns finishes of fourth and first here; Logano checked in sixth and ninth. They also swept the short-flat track wins earlier this season – Blaney winning at Phoenix and Logano at North Wilkesboro.
William Byron ranks third with finishes of first and second at Iowa Speedway, but he hasn’t shown the same winning speed on short flat tracks this year. This model also flags two more Penske-affiliated Ford Mustangs for the win: Austin Cindric (eighth overall) and Josh Berry (13th). I don’t have real faith in either to pull off the win, though Cindric could be interesting in the top-10 market.
Berry is having a difficult season and is out of a ride at year’s end – so confidence is rather low on the No. 21 Ford Mustang Dark Horse this weekend. Here are the model’s fair market values (Win / Top 3 / Top 5) for those five drivers:
- Ryan Blaney: +377 / +105 / -197
- Joey Logano: +420 / +119 / +150
- William Byron: +444 / +122 / +150
- Austin Cindric: +2191 / +506 / +231
- Josh Berry: +6982 / +1475 / +645
Other Drivers Showing Value
- Chase Briscoe: Top 5 (+144)
- Carson Hocevar: Top 3 (+613) and Top 5 (+275)
- Brad Keselowski: Top 5 (+320)
Recommended Bets
I don’t blindly fire on every number the model spits out – especially before practice and qualifying. Right now, I’m only willing to play one spot at a small stake (0.25 units). I’m personally mostly a post-practice / qualifying bettor.
- Joey Logano: Top 5 (+150)
It came down to Joey Logano or William Byron – the classic track-history-versus-current-form debate. Byron owns the stronger Iowa resume, but Logano has been lights-out on comparable short flats this season. That edge is enough for me to take the +150.

Final Thoughts
I’ll update the model after practice and qualifying. Rankings can swing hard once the cars hit the track. If you want to follow along, check out Before the Green on YouTube and X (@HighLineBetting) every Sunday at 11:00 AM ET.
BETTING GLOSSARY
Fair Market Value (FMV): The odds the model believes a driver should be priced at based on projected performance. Example: Tyler Reddick’s FMV is +608. If the actual market offers longer odds than that, the model sees value.
Value / Flashing Value: When the market odds are longer (higher payout) than the model’s fair market value. You’re getting a better price than the model thinks the true probability deserves. Example: “My model is showing clear value on two drivers” and “other drivers flashing value on the win market.”
Win Market / To-Win: Betting on a driver to finish 1st. Example: The entire “to-win value” section lists drivers the model likes to take the checkered flag at prices better than their FMV.
Placement Props (Top 3 / Top 5 / Top 10): Bets on a driver finishing inside a specific position range rather than winning outright. These usually offer shorter odds but higher hit rates. Example: “Byron Top 3 FMV +267 and Top 5 +145” and the recommended “William Byron Top 5 +225”.
American Odds (+ numbers): The standard U.S. format. A +608 price means a $100 bet results in $608 in profits (plus your $100 stake back). Higher positive numbers = bigger underdogs and bigger potential payouts. Example: John Hunter Nemechek’s win of +4333 or his Top 10 at +201.
Pre-Practice / Pre-Qualifying Model: Rankings generated before any on-track activity this weekend. These numbers will shift once practice speeds and qualifying results come in.